Can we use Terraform for local development environments? Why not. Though its not the fastest.
This is the third of three posts exploring creating, testing, deploying, and observing a non-trivial REST application created using Spring Boot:
- Part 1: build a modern Spring REST application using Aggregates, Command Query Separation, and sensible unit tests
- Part 2: deploy the application to a local Kubernetes cluster using KIND, Helm, and the new GatewayAPI for HTTP access
- Part 3: use Terraform to create the local development environment and add Prometheus and Grafana observation
Last post I deployed a demo spring boot application into a Kubernetes kind cluster, using Bash scripts to orchestrate the various technologies involved. While it worked, using shell scripts to automate creating and destroying the cluster, infrastructure, and application felt hacky - I wished for a more structured way of orchestrating things …
If only there was something that could allow me to define and provision local infrastructure using declarative configuration files?
I want to try and create the same demo/development environment using Terraform instead of bash scripts. Let me say up front, this is not a template for production use! Because of the Development nature of the environment I was able to use Terraform to do things that would not necessarily be advisable in production. As with many tools, Terraform has many use cases.
To create the Development environment with Terraform I want to:
- create a
kindcluster with 3 nodes - make Docker run
cloud-provider-kindfor the Gateway - have Helm install Postgres, pgadmin, and Prometheus/Grafana
- deploy 5 replicas of the Spring REST application
- run a job to seed the (now) distributed application
I ended up creating 3 Terraform installations:
- cluster (kind)
- infrastructure (Postgres, pgadmin, Prometheus/Grafana)
- application (the Spring REST demo)
This meant I could use small (and simple) convenience scripts to bring everything up and down, and be able to update parts of the system independently.
To bring everything up run (from the terraform directory):
terraform -chdir=kind init
terraform -chdir=kind apply -auto-approve
sleep 30

terraform -chdir=infra init
terraform -chdir=infra apply -auto-approve

terraform -chdir=app init
terraform -chdir=app apply -auto-approve
Alternatively, run the
./up.shscript
On my laptop this it about 6 minutes for all the pods to be ready and the seeder job to complete. It should look like this:
> kubectl get po -A
NAMESPACE            NAME                                                      READY   STATUS      RESTARTS   AGE
application          springapp-6f849fd676-b48z7                                1/1     Running     0          2m27s
application          springapp-6f849fd676-bxkdc                                1/1     Running     0          2m27s
application          springapp-6f849fd676-k9226                                1/1     Running     0          2m27s
application          springapp-6f849fd676-sfz6d                                1/1     Running     0          2m27s
application          springapp-6f849fd676-w49kz                                1/1     Running     0          2m27s
application          springseed-f6wt9                                          0/1     Completed   0          55s
kube-system          coredns-7d764666f9-9vx6r                                  1/1     Running     0          6m29s
kube-system          coredns-7d764666f9-gk8t6                                  1/1     Running     0          6m29s
kube-system          etcd-springapp-cluster-control-plane                      1/1     Running     0          6m37s
kube-system          kindnet-hh4gb                                             1/1     Running     0          6m29s
kube-system          kindnet-q2pm2                                             1/1     Running     0          6m28s
kube-system          kindnet-tvbbv                                             1/1     Running     0          6m28s
kube-system          kube-apiserver-springapp-cluster-control-plane            1/1     Running     0          6m37s
kube-system          kube-controller-manager-springapp-cluster-control-plane   1/1     Running     0          6m37s
kube-system          kube-proxy-5mz2s                                          1/1     Running     0          6m29s
kube-system          kube-proxy-76m29                                          1/1     Running     0          6m28s
kube-system          kube-proxy-jbp8j                                          1/1     Running     0          6m28s
kube-system          kube-scheduler-springapp-cluster-control-plane            1/1     Running     0          6m37s
local-path-storage   local-path-provisioner-67b8995b4b-xw66k                   1/1     Running     0          6m29s
pgadmin              pgadmin-0                                                 1/1     Running     0          5m36s
postgres             postgres-0                                                1/1     Running     0          5m36s
prometheus           prometheus-grafana-7f84984f7d-l4tkw                       3/3     Running     0          4m33s
prometheus           prometheus-kube-prometheus-operator-67f88f78c6-66gsf      1/1     Running     0          4m33s
prometheus           prometheus-kube-state-metrics-d585bd88d-6slbg             1/1     Running     0          4m33s
prometheus           prometheus-prometheus-kube-prometheus-prometheus-0        2/2     Running     0          4m17s
prometheus           prometheus-prometheus-node-exporter-2w4dn                 1/1     Running     0          4m33s
prometheus           prometheus-prometheus-node-exporter-g7n9g                 1/1     Running     0          4m33s
prometheus           prometheus-prometheus-node-exporter-nxlff                 1/1     Running     0          4m33s
To access the cluster we need the IP address of the Gateway:
> kubectl get gateway -A
NAMESPACE             NAME                  CLASS                 ADDRESS      PROGRAMMED   AGE
application-gateway   application-gateway   cloud-provider-kind   **172.18.0.4**   True         5m17s
Using the IP, we can issue a curl to check we have access and the database is seeded (the header is used by the HTTPRoute to direct traffic to the application):
curl -H "Host: application" http://172.18.0.4:80/api/customers
This should hit the following method in CustomerQueryController:
@GetMapping
Page<CustomerSummaryView> findCustomers(
        @RequestParam(required = false) String name,
        Pageable pageable
) {
    return customerQueryService.findCustomers(name, pageable);
}
If all is well, it should return a paginated result (thanks to org.springframework.data.domain.Pageable):
curl -H "Host: application" http://172.18.0.4:80/api/customers
{"content":[{"id":31219,"displayName":"Alice Allen"},{"id":6048,"displayName":"Alice Allen"},{"id":29901,"displayName":"Alice Allen"},{"id":18419,"displayName":"Alice Allen"},{"id":7813,"displayName":"Alice Allen"},{"id":26007,"displayName":"Alice Allen"},{"id":23844,"displayName":"Alice Allen"},{"id":29265,"displayName":"Alice Allen"},{"id":13290,"displayName":"Alice Allen"},{"id":1333,"displayName":"Alice Allen"},{"id":21029,"displayName":"Alice Allen"},{"id":15190,"displayName":"Alice Allen"},{"id":702,"displayName":"Alice Allen"},{"id":18958,"displayName":"Alice Allen"},{"id":6024,"displayName":"Alice Allen"},{"id":9085,"displayName":"Alice Allen"},{"id":20279,"displayName":"Alice Brown"},{"id":15754,"displayName":"Alice Brown"},{"id":16101,"displayName":"Alice Brown"},{"id":3927,"displayName":"Alice Brown"}],"empty":false,"first":true,"last":false,"number":0,"numberOfElements":20,"pageable":{"offset":0,"pageNumber":0,"pageSize":20,"paged":true,"sort":{"empty":false,"sorted":true,"unsorted":false},"unpaged":false},"size":20,"sort":{"empty":false,"sorted":true,"unsorted":false},"totalElements":5000,"totalPages":250}
K6 Tests
I have included read and write tests for K6. Run the write test like this:
user:~/Code/spring-boot-kubernetes/terraform$ k6 run \
  -e TEST_PROFILE=smoke \
  -e BASE_URL=http://172.18.0.4 \
  -e HOST_HEADER=application \
  ../k6/write-test.js
Same for the read test:
user:~/Code/spring-boot-kubernetes/terraform$ k6 run \
  -e TEST_PROFILE=smoke \
  -e BASE_URL=http://172.18.0.4 \
  -e HOST_HEADER=application \
  ../k6/read-test.js
You can also run using TEST_PROFILE=load and TEST_PROFILE=stress.
pgadmin
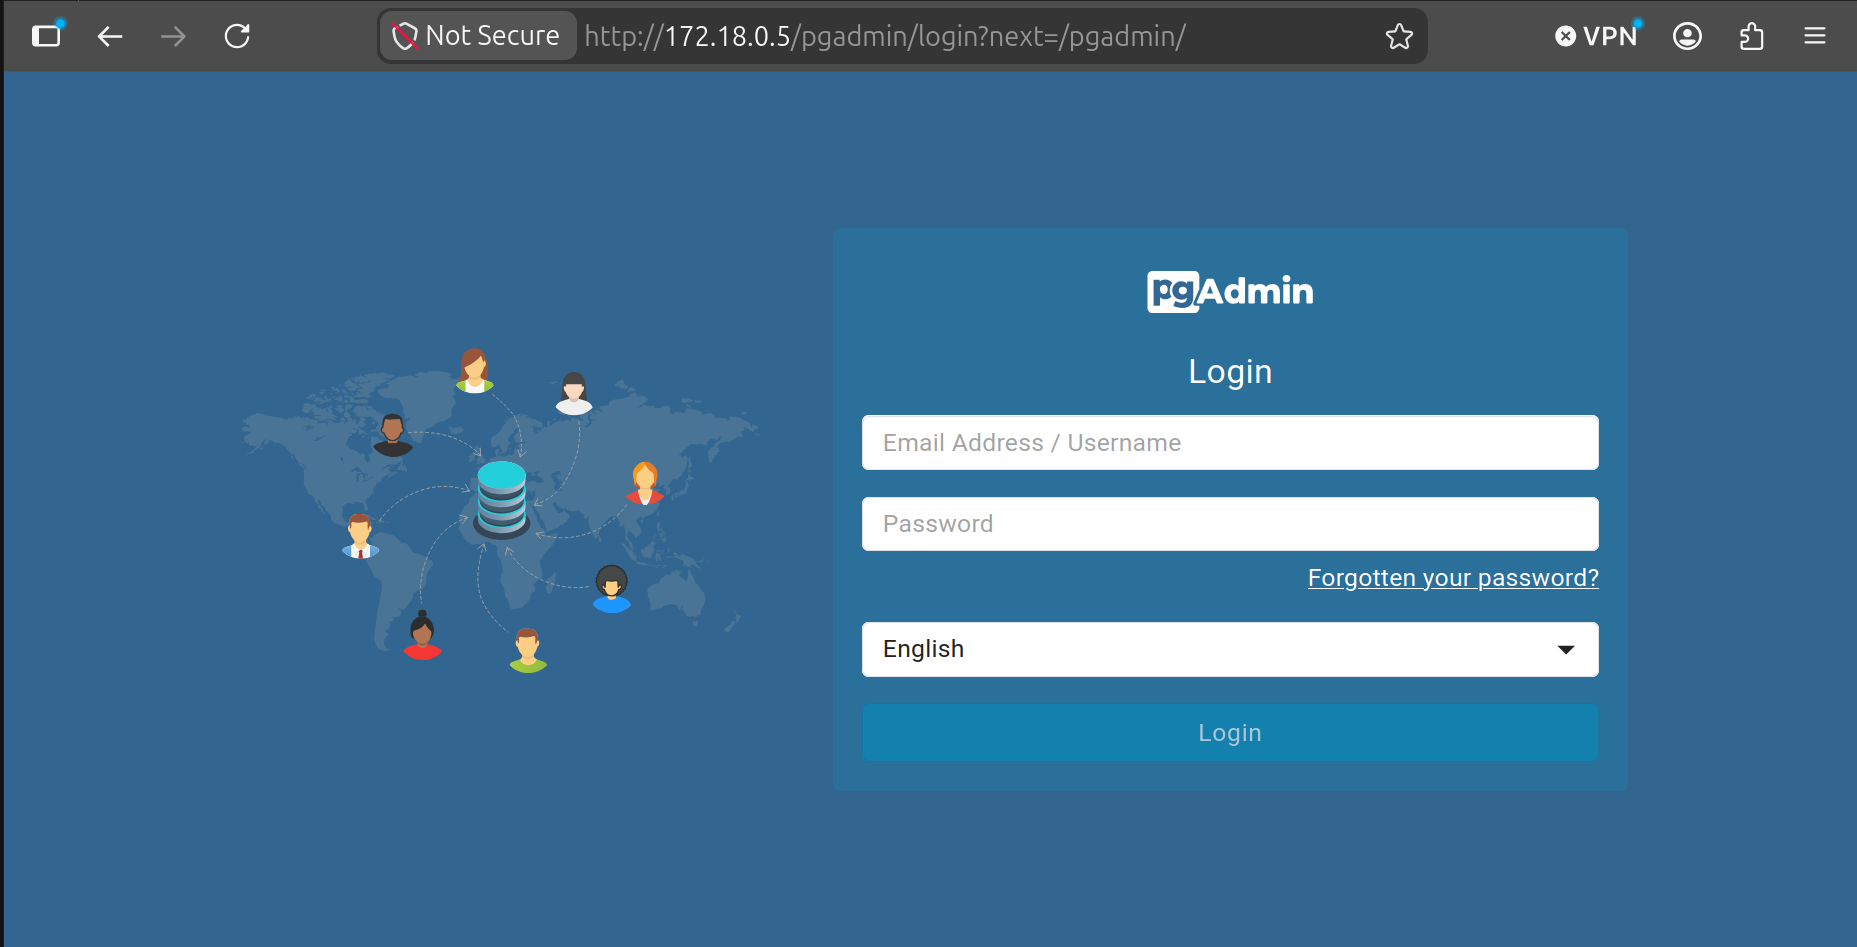
pagadmin should now be available ay http://<gateway-ip>/pgadmin/. To login use user@somewhere.com/pgadmin:
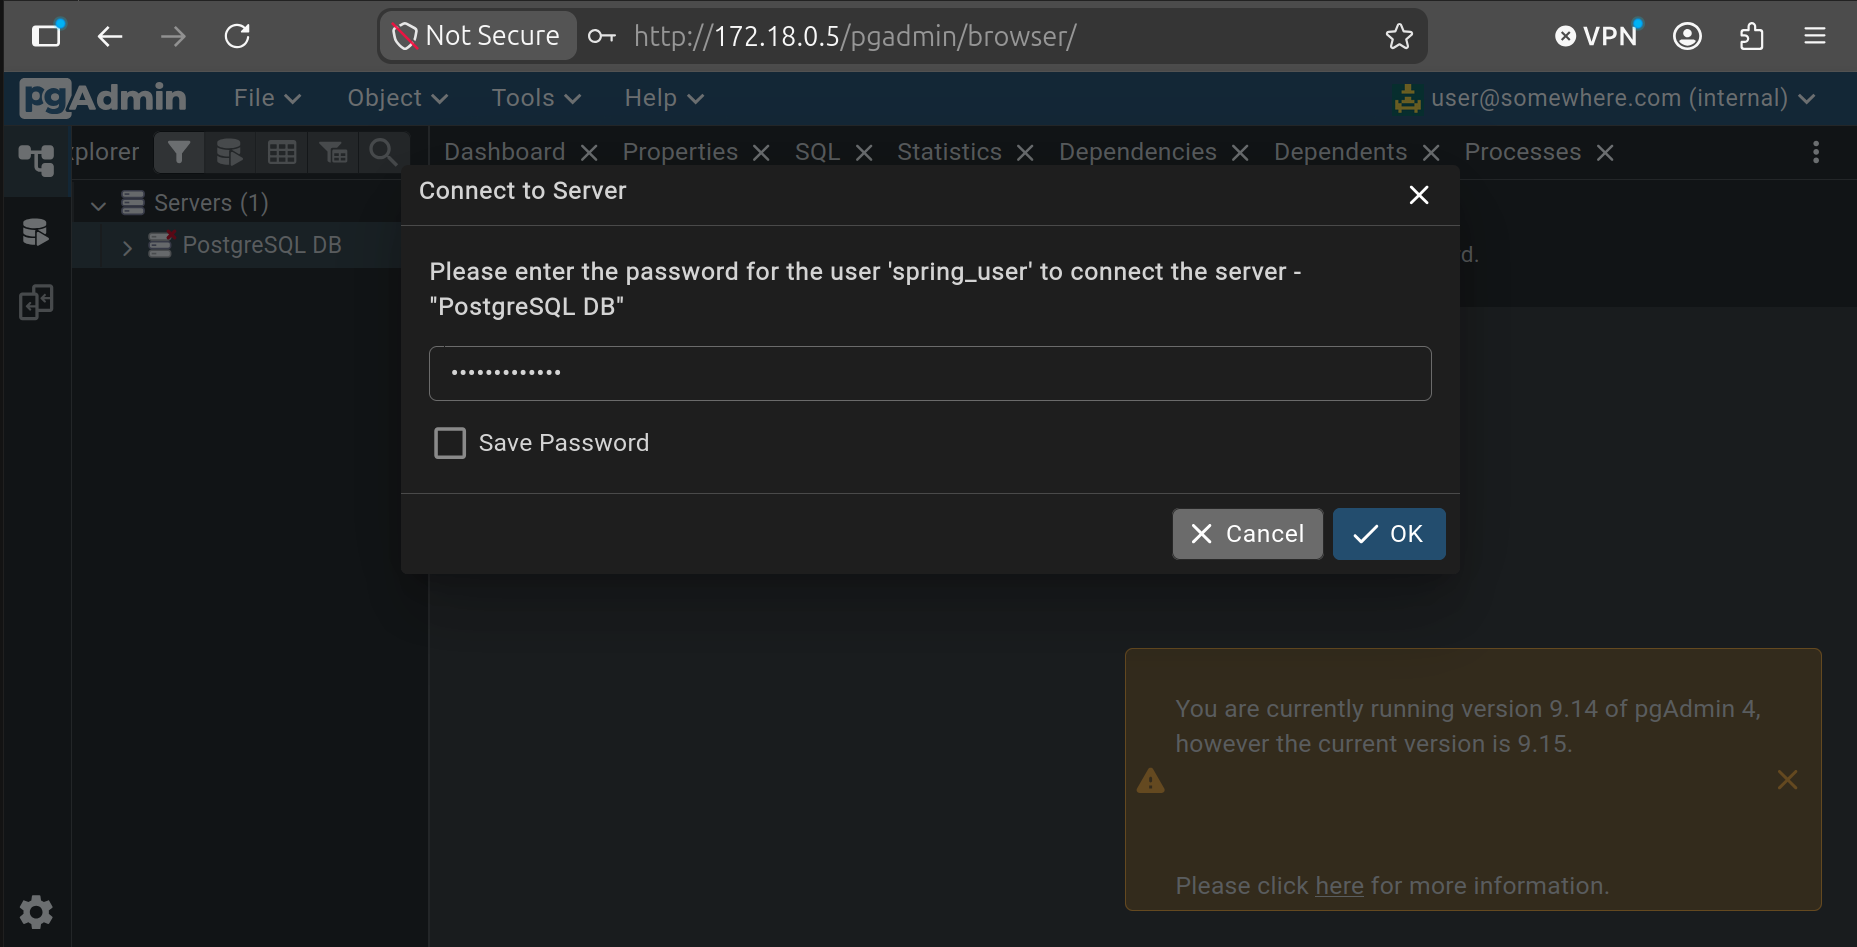
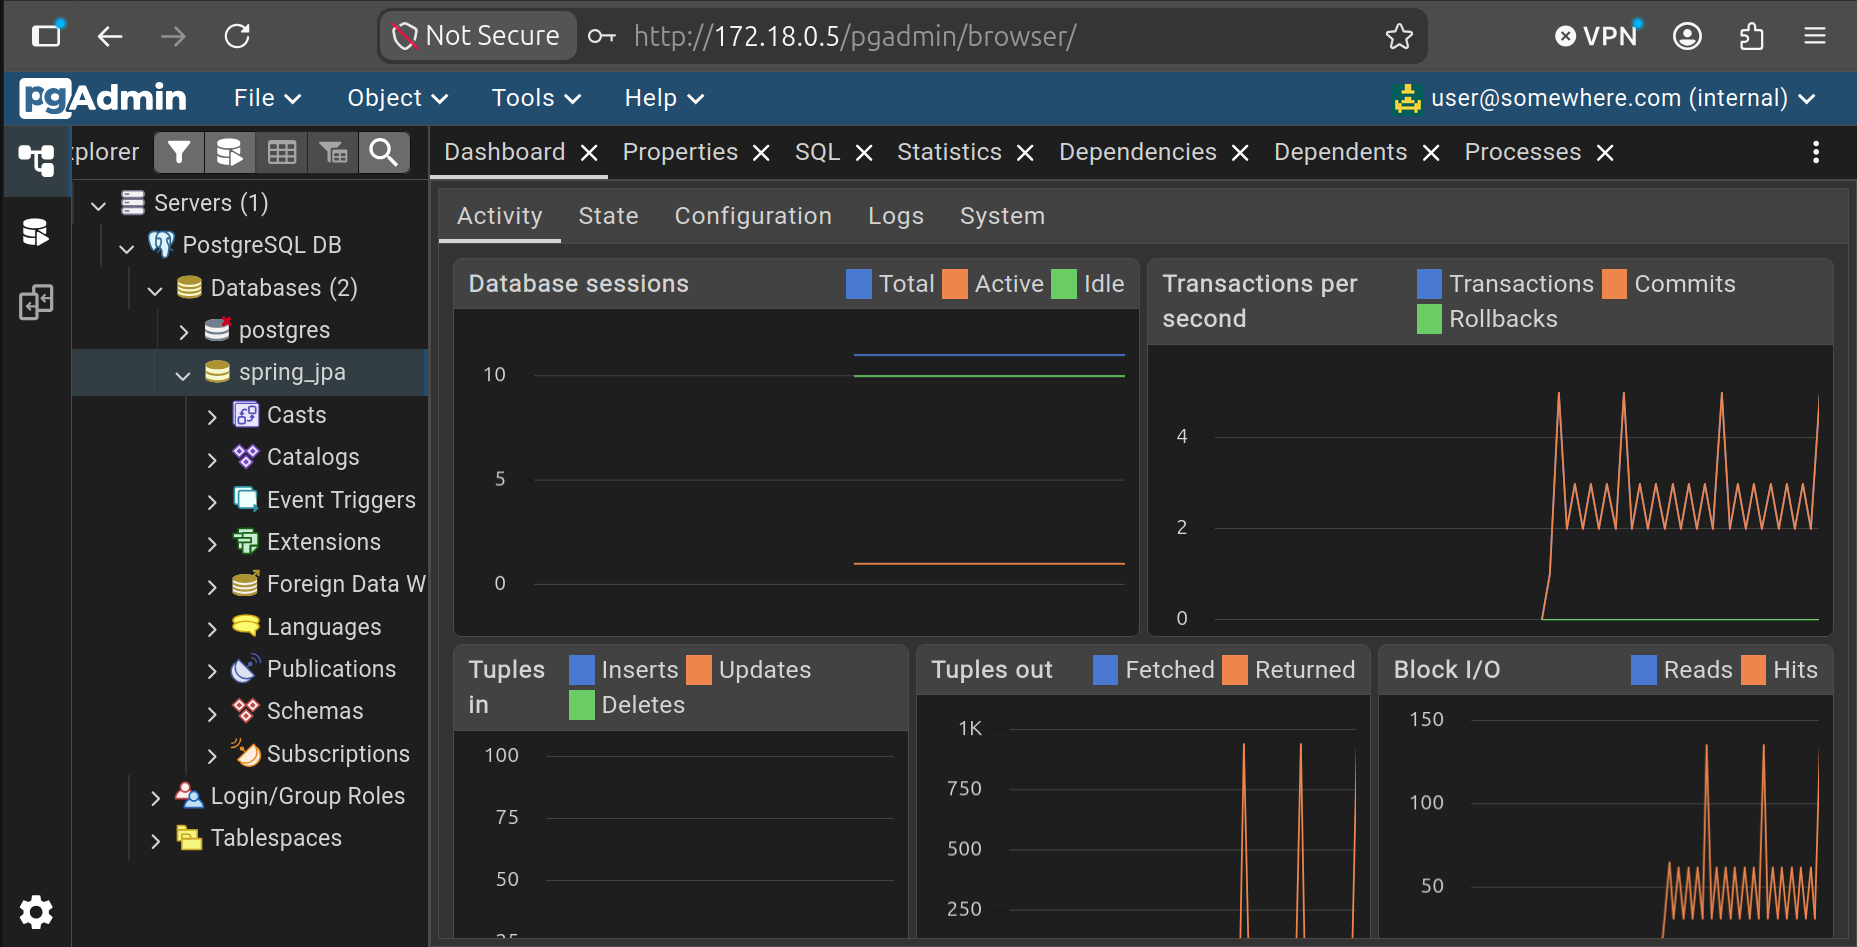
You will also need to use password change-me-now to connect to the database.
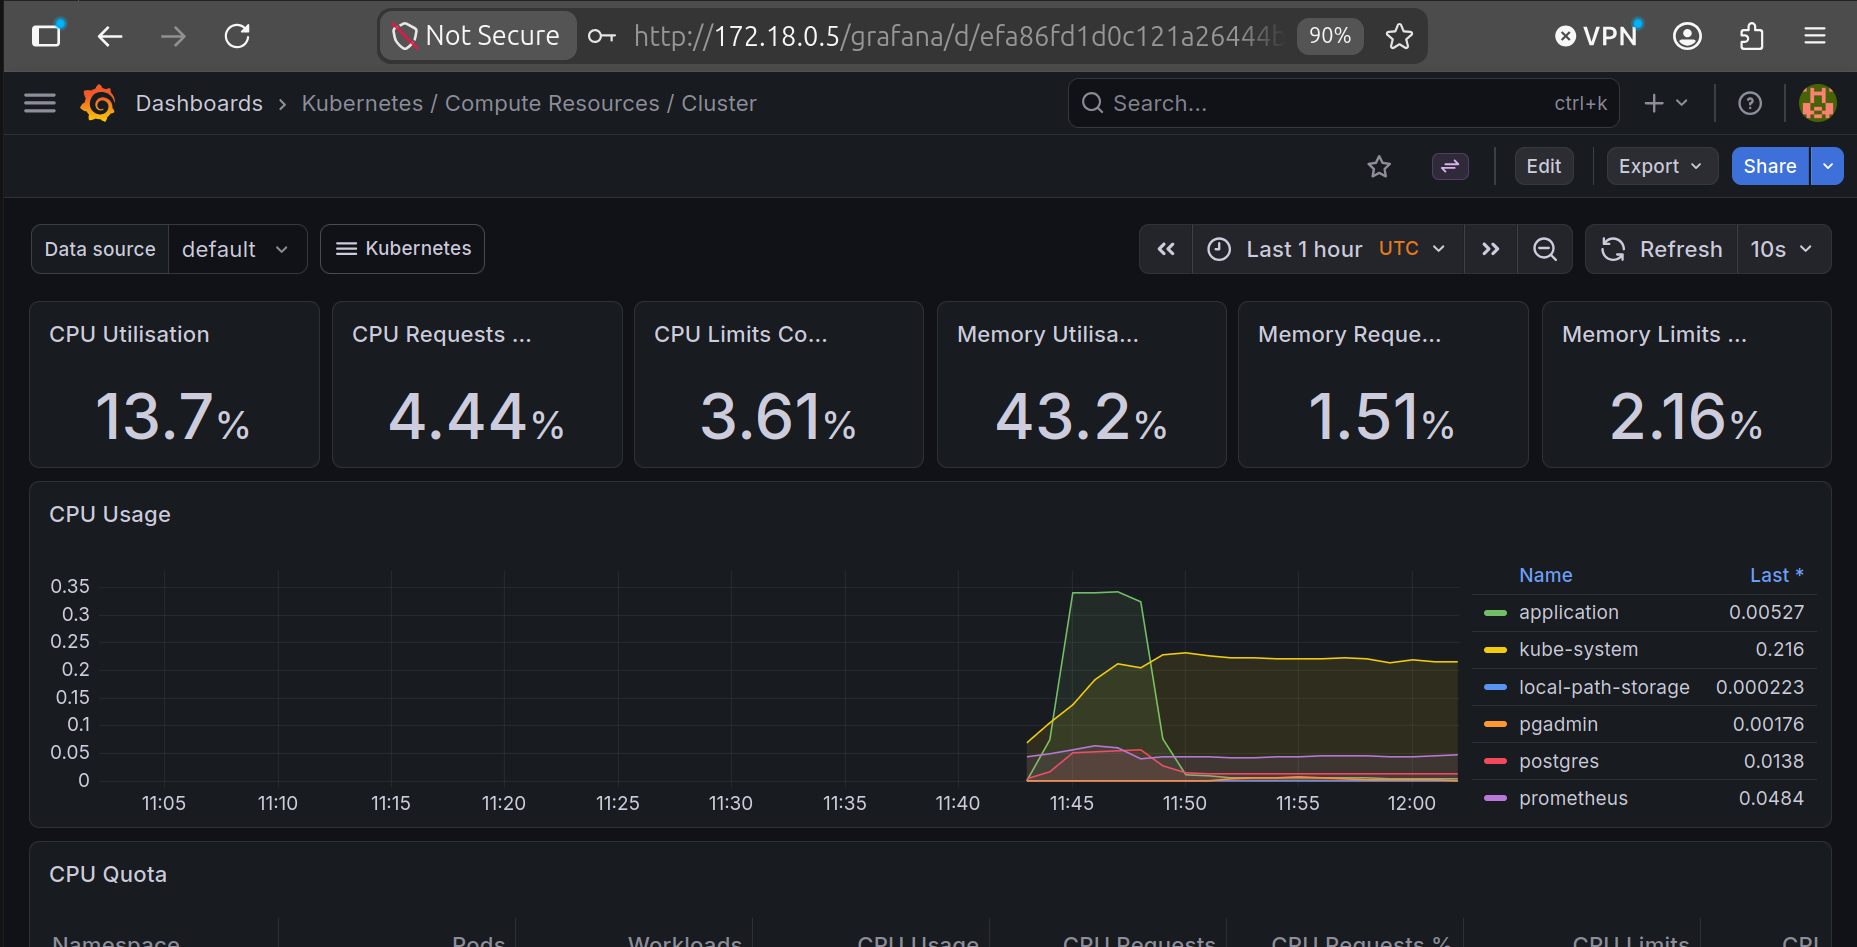
Prometheus and Grafana
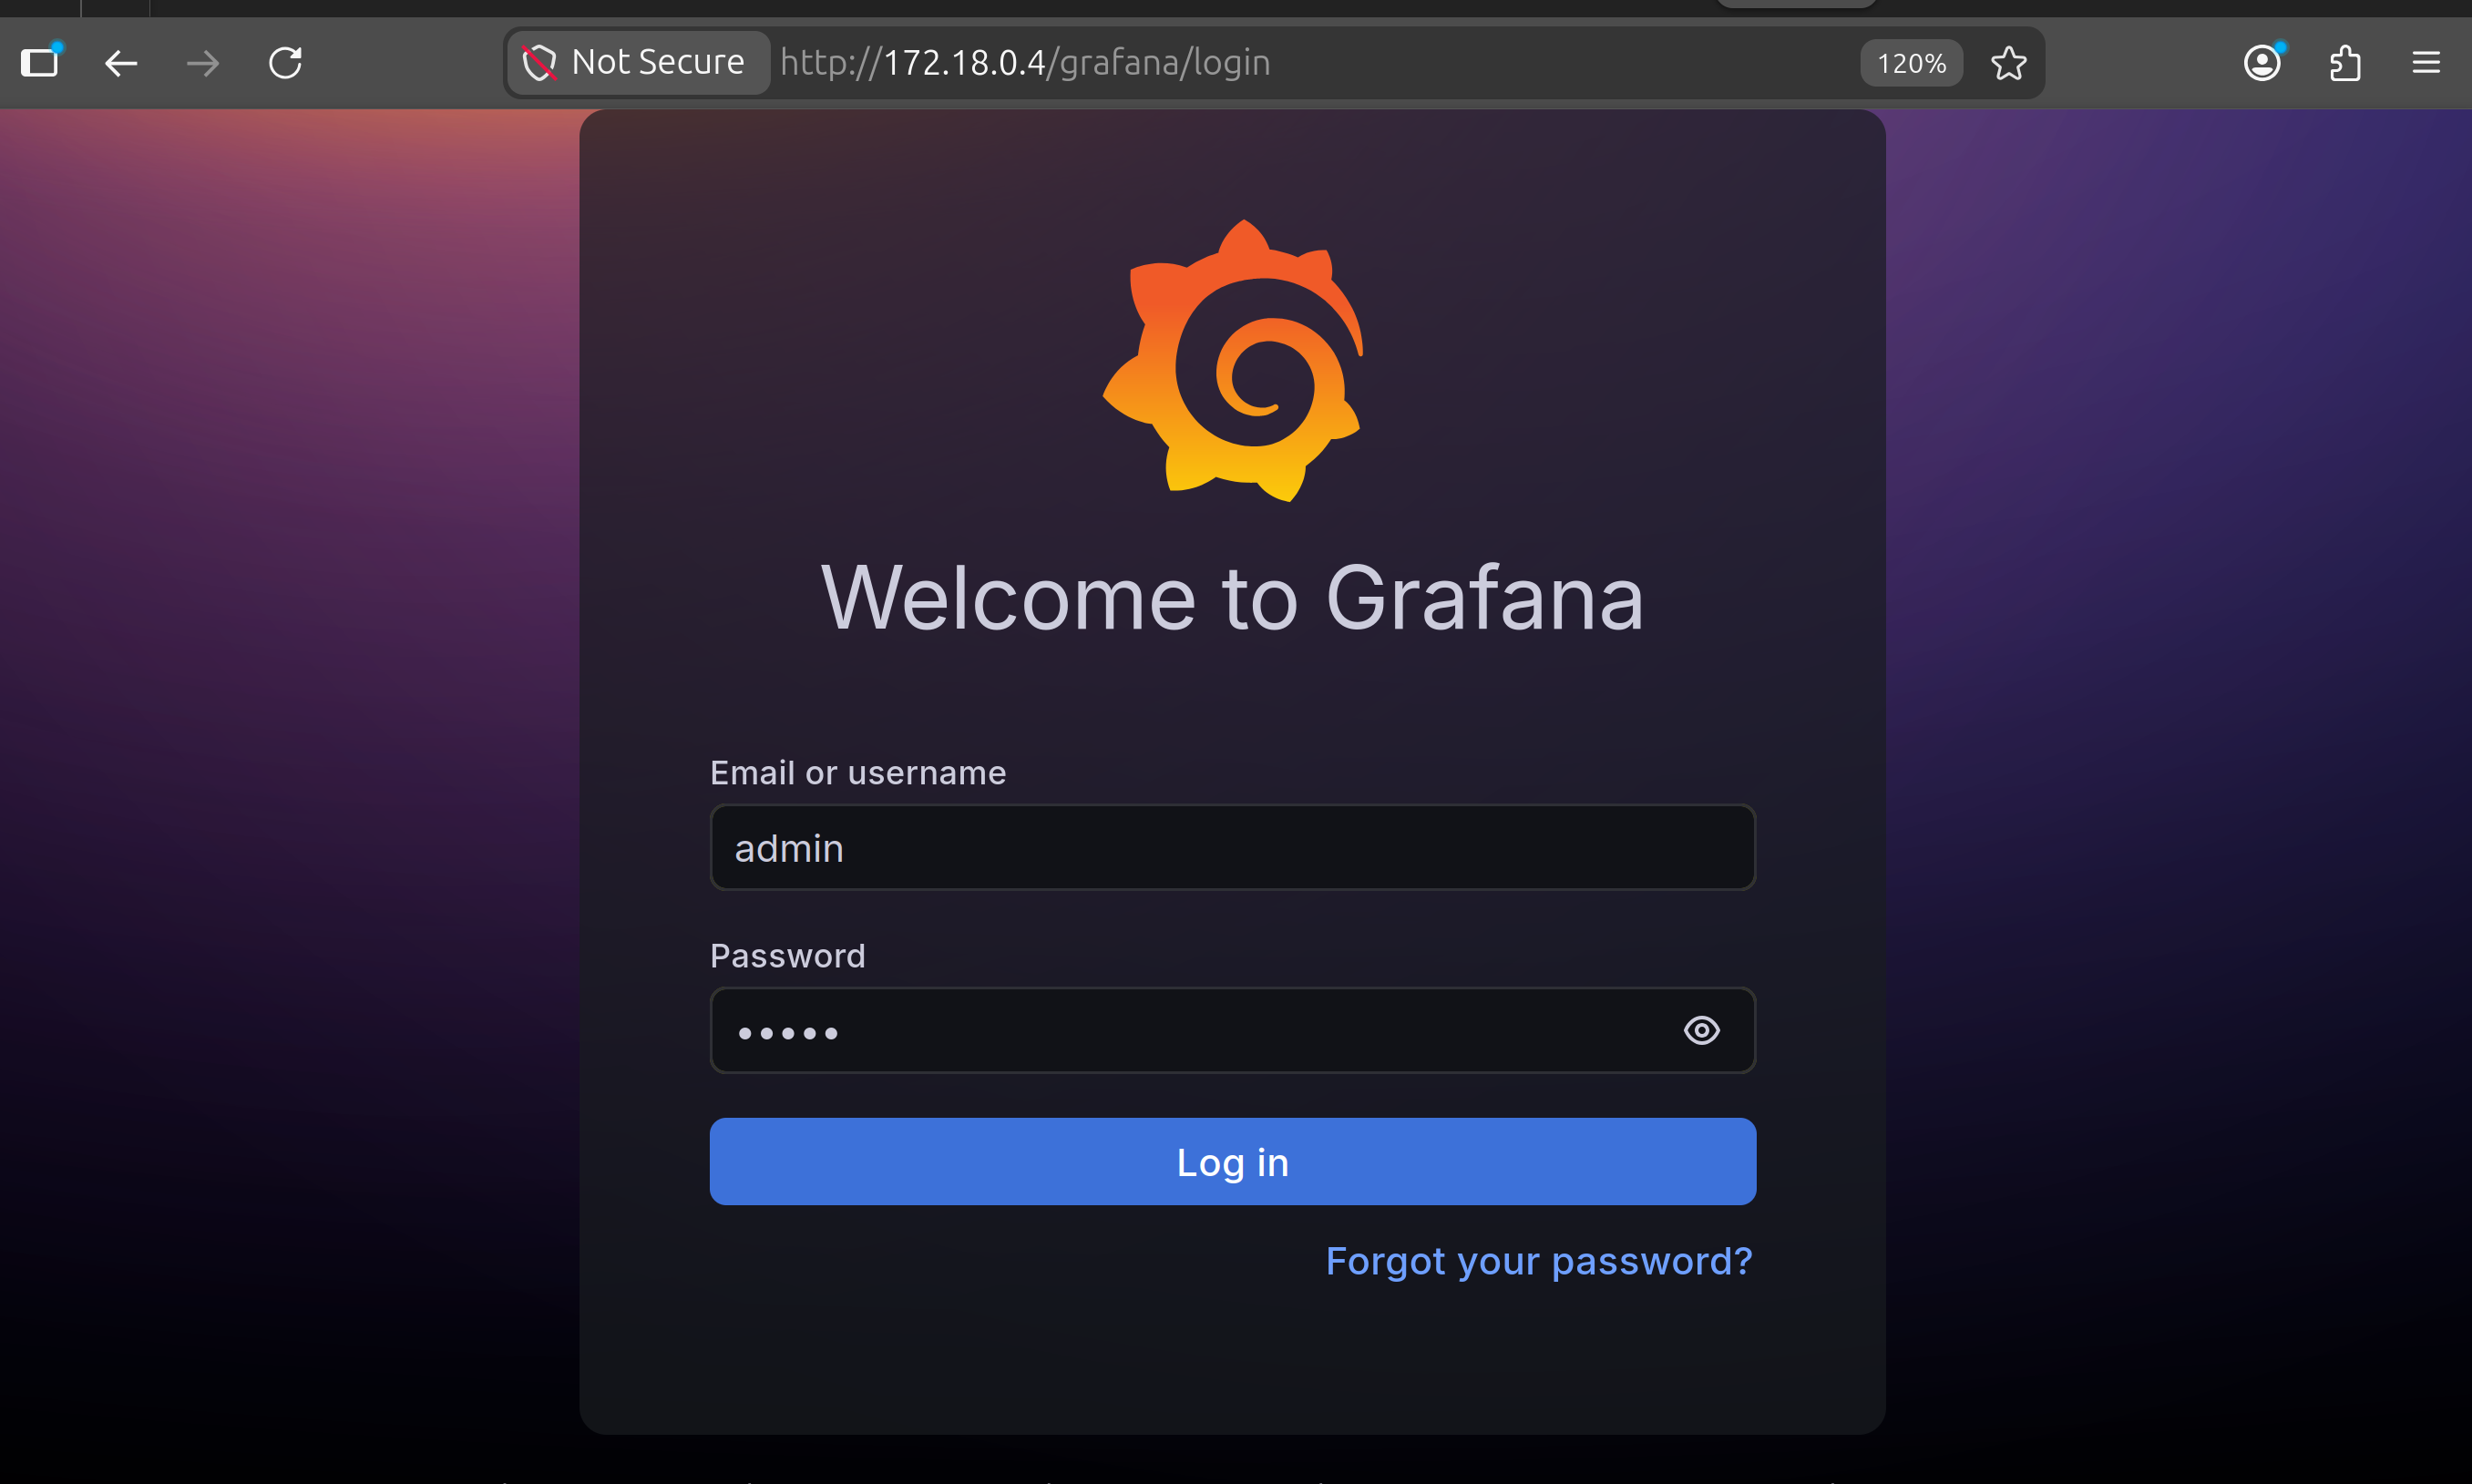
Grafana is available at the path /grafana. To login use admin/admin:
Bring it all down
To destroy the cluster, infrastructure, and application:
terraform -chdir=app destroy -auto-approve
terraform -chdir=infra destroy -auto-approve
terraform -chdir=kind destroy -auto-approve
Alternatively, run the
./down.shscript
Conclusion
While using Terraform to create a Development environment involves practices one would not want to use for production, it provides a repeatable and modular approach that can be easily reasoned over. In many ways the Terraform was quicker to write and get working than the bash scripts - and much easier to troubleshoot.
On the other hand, the scripts are a lot faster to run :)
Resources
- Terraform kind provider
- Prometheus helm chart simplified
- kube-prometheus-stack
- Monitor a Spring Boot App Using Prometheus
- Install pgadmin in kubernetes
’